Riemann Sum
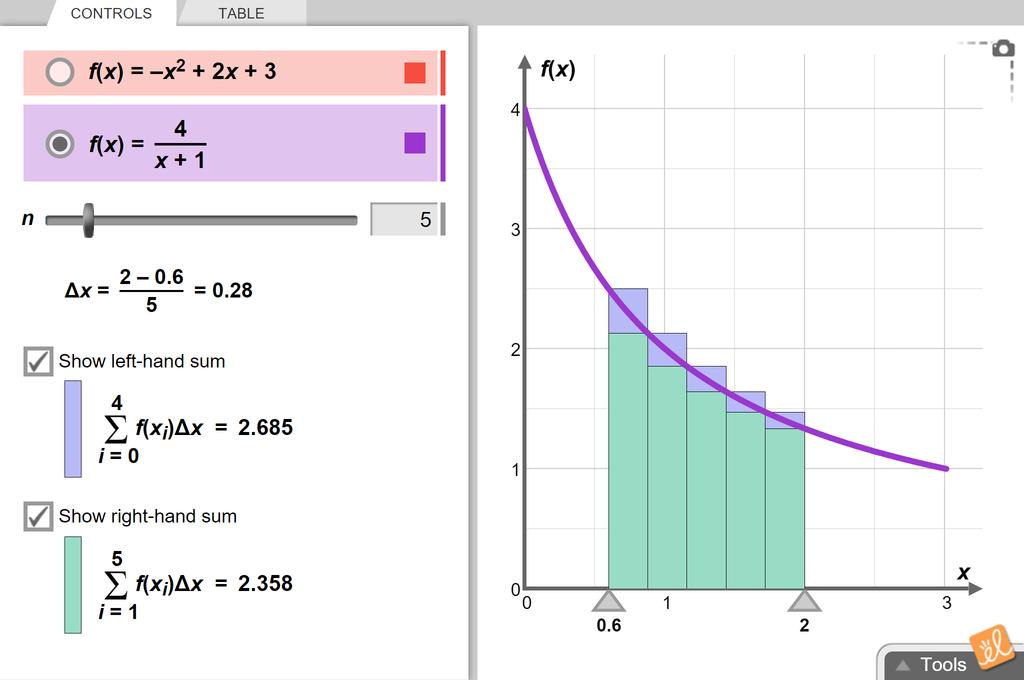
Approximate the area under a curve in an interval using rectangles. Compare the results of left-hand summation to the results of right-hand summation. Vary the interval and the number of rectangles and explore how the graph of the rectangles and curve change in response.
Launch GizmoRiemann Sum
Approximate the area under a curve in an interval using rectangles. Compare the results of left-hand summation to the results of right-hand summation. Vary the interval and the number of rectangles and explore how the graph of the rectangles and curve change in response.
5 Minute Preview
Use for 5 minutes a day.