As states move to computer-based platforms for their assessments, the ability to ask questions in ways that would not be possible or practical with paper-based tests is greatly enhanced. The trend is certainly growing; currently, more than 30 states use computer-based testing in science, and even more do so in math.
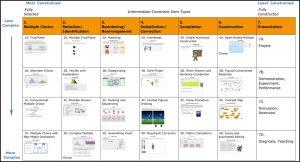
Dr. Kathleen Scalise at the University of Oregon hascategorized 28 types of test items. These item types have responses that fall somewhere between most constrained responses—for example, conventional true-false and multiple-choice questions—and least constrained, or fully constructed responses, such as projects and essay questions. When looking at Scalise’s chart, we find many question types that would be difficult if not impossible on paper-based assessments, but could be—and are—easily utilized in computer-based assessments.
For example: 6A, Open Ended Multiple Choice. With a computer-based assessment, it is possible to provide a graph and ask students to move data points to specific places on the graph to represent data. This is multiple choice, but with an almost infinite number of possible choices.
Limited Figural Drawing items (4C) absolutely cannot be accomplished with paper tests. In this example, students can adjust two aspects of the picture to show their understanding of the concept of the variables that affect shadows.
A matrix completion item (5D) could be accomplished on paper, but with drag-and-drop in a computer-based test, it can be easily administered and automatically scored.
Computer-based assessments make many more question types possible that are more complex than most paper-based assessments. And with those possibilities come the need for students to not just “provide an answer” or select vocabulary word definitions, but to understand what the questions themselves require, and provide the evidence and reasoning needed to support their answers to those questions.
How have students performed on computer-based assessments so far?
Much of what we know about how students performed on specific types of questions comes via a 2009 study by the National Center for Education Statistics, using the National Assessment of Educational Progress that is given in Grades 4, 8 and 12. In 2009 they administered a computer assessment and completed a study related to the assessment results.
In science, the study found that students were successful when they were looking at limited data sets and making straightforward observations with the data. It got more difficult when investigations had more variables or when they needed to make strategic decisions to collect their data. Students did satisfactorily when asked to select correct conclusions about an investigation, but had a great deal of difficulty explaining the results.
For example, 80% of fourth graders could test how three levels of sunlight affected plant growth using six different trays, but only 35% could design an investigation when they had nine fertilizer levels to test and only six trays to test them in. The fact that they had to make strategic choices kept them from being successful.
Similar results were reported with grades 8 and 12. In terms of selecting conclusions, a significantly lower percentage of students in all three grade levels could support their explanations with evidence from the investigation, than when they were asked to make the correct selection without supporting it with evidence.
Overall, the study had two significant findings:
- Students are successful with limited data sets and straightforward observations.
- Students struggle with:
• Multiple variables,
• Making strategic decisions, and
• Explaining conclusions and supporting them with evidence.
The second conclusion is troubling, in light of the fact that these are exactly the types of test items students face in computer-based assessments.
In addition,datashows that the less experience students have with computers prior to computer-based assessments, the worse the typical scores are, across all grade levels and demographics.
Help students prepare for computer-based assessments
It’s important that teachers plan lessons that allow students the opportunity to become more strategic with their decisions about multiple variables and get practice in providing evidence to support their conclusions. This can be done through ExploreLearning Gizmos, whose interactive design helps students manipulate variables; analyze data; and explore, discover, and apply new concepts at a deeper level.
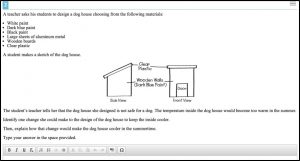
In this assessment question for fifth graders in Ohio, students are asked to analyze a doghouse design and recommend changes to it to make the house cooler in the summer. They then have to explainhowthose changes would keep the inside cooler.
ExploreLearning’s
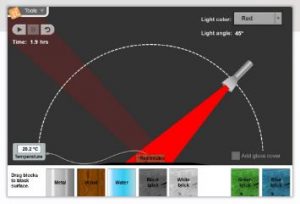
Heat AbsorptionGizmo has students shine a flashlight on a variety of materials and measure how quickly each material heats up. Students can manipulate the light angle, light color, and type and color of material. The Gizmo helps students understand that an object has a certain color because it reflects light of that color and allows them to compare the relationship of the heating of objects to different colors of light. Students can also add a glass cover to simulate a greenhouse or the roof of a building, and measure the effect of using a dome over heated material. These are both important concepts for those students as they analyze a doghouse design to recommend changes to the doghouse.
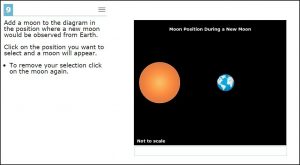
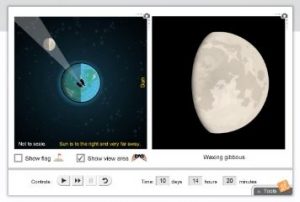
Another fifth-grade question, this one from Utah, asks students to add the moon in the correct position for a New Moon.
In thePhases of the Moon小发明,学生观察月球、地球和太阳nd learn how their positions are related to the phases of the Moon. Students can model a New Moon by dragging the Moon directly between the Earth and the Sun themselves, and can continue investigating each phase of the Moon. Upon completion of the Gizmo, Utah students would easily be able to complete the assessment diagram by selecting the correct position of the moon during the New Moon phase.
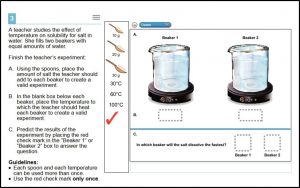
An eighth-grade physical science question from Oregon asks students to set up a controlled experiment of the effect of temperature on solubility for salt in water. Students have to know how to set up the experiment and also how to predict in which beaker salt will dissolve the fastest.
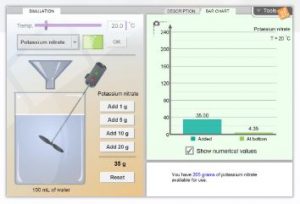
TheSolubility and TemperatureGizmo allows students to measure the effect of
温度对溶解度的两种不同的substances, including salt, by adding varying amounts of a chemical to a beaker of water to create a solution and then measuring the concentration of the solution at the saturation point. As students design and perform their own experiments to test how temperature affects solubility, they discover that an increase in temperature has a greater effect on the solubility of potassium nitrate than on sodium chloride. This Gizmo not only helps students gain a deeper understanding of how temperature affects solubility, but also gives them practice in designing controlled experiments, collecting data, and analyzing the data to support their conclusions.
Conclusion
As state assessments continue to move solely to a computer-based format, it is clear that teachers need to change their instruction to help move students to an assessment world that includes these kinds of questions—one with questions that require more fully constructed responses and that are more complex than they are used to.
Gizmos were designed to support just that kind of instruction.
 在收到她的作为。在科学教育和teaching science in middle and high school classrooms for nine years, Pam Larson began working for ExploreLearning in 2007. As the Director of Professional Development, Ms. Larson has been instrumental in designing curriculum for science and math professional development sessions, in delivering a variety of conference presentations across the United States and Canada, and in managing instructors who work directly with teachers using ExploreLearning products.
Pass it on!
